Is your data already stored in tabular models in the Power BI Service, Microsoft Fabric, or SQL Server Analysis Services on-premises? And would you like to access that data not only through Power BI, but also directly from Excel?
If you have tried to do this before, you may have noticed that Excel, despite being a Microsoft product itself, quickly reaches its limits when working with modern tabular models.
That’s exactly what XLiQ made for!
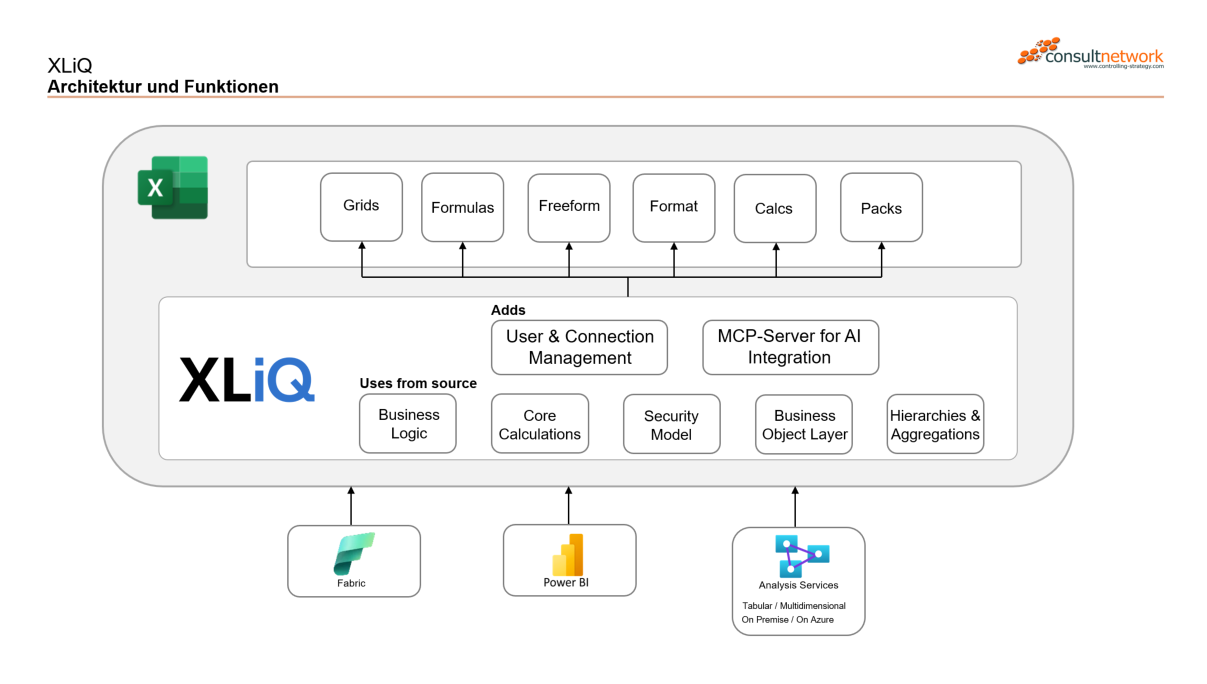
The Excel add-in combines the flexibility and familiarity of Excel with Microsoft’s tabular models, which are designed for modern reporting and analytics. This gives you direct access to your data, allowing you to create powerful analyses and reports without leaving the Excel environment you already know.
At the same time, key requirements such as security, access permissions, and data governance remain in place.
XLiQ is designed for Excel professionals, particularly those working in controlling and finance, who want to combine their existing Excel expertise with modern tabular models in Power BI and Microsoft Fabric.1
XLiQ brings the flexibility of Microsoft Excel directly to your central BI data foundation. The Excel add-in enables controllers and other business users to analyze data from Power BI, Microsoft Fabric, and Analysis Services directly in Excel and create customized reports without relying on static data exports.
Reports remain directly connected to the underlying data source in read-only mode and can be refreshed at any time. This means you are always working with up-to-date data while continuing to use the familiar Excel environment for layouts, formatting, formulas, and your own calculations. Individual analyses can be designed flexibly and adapted to specific business requirements.
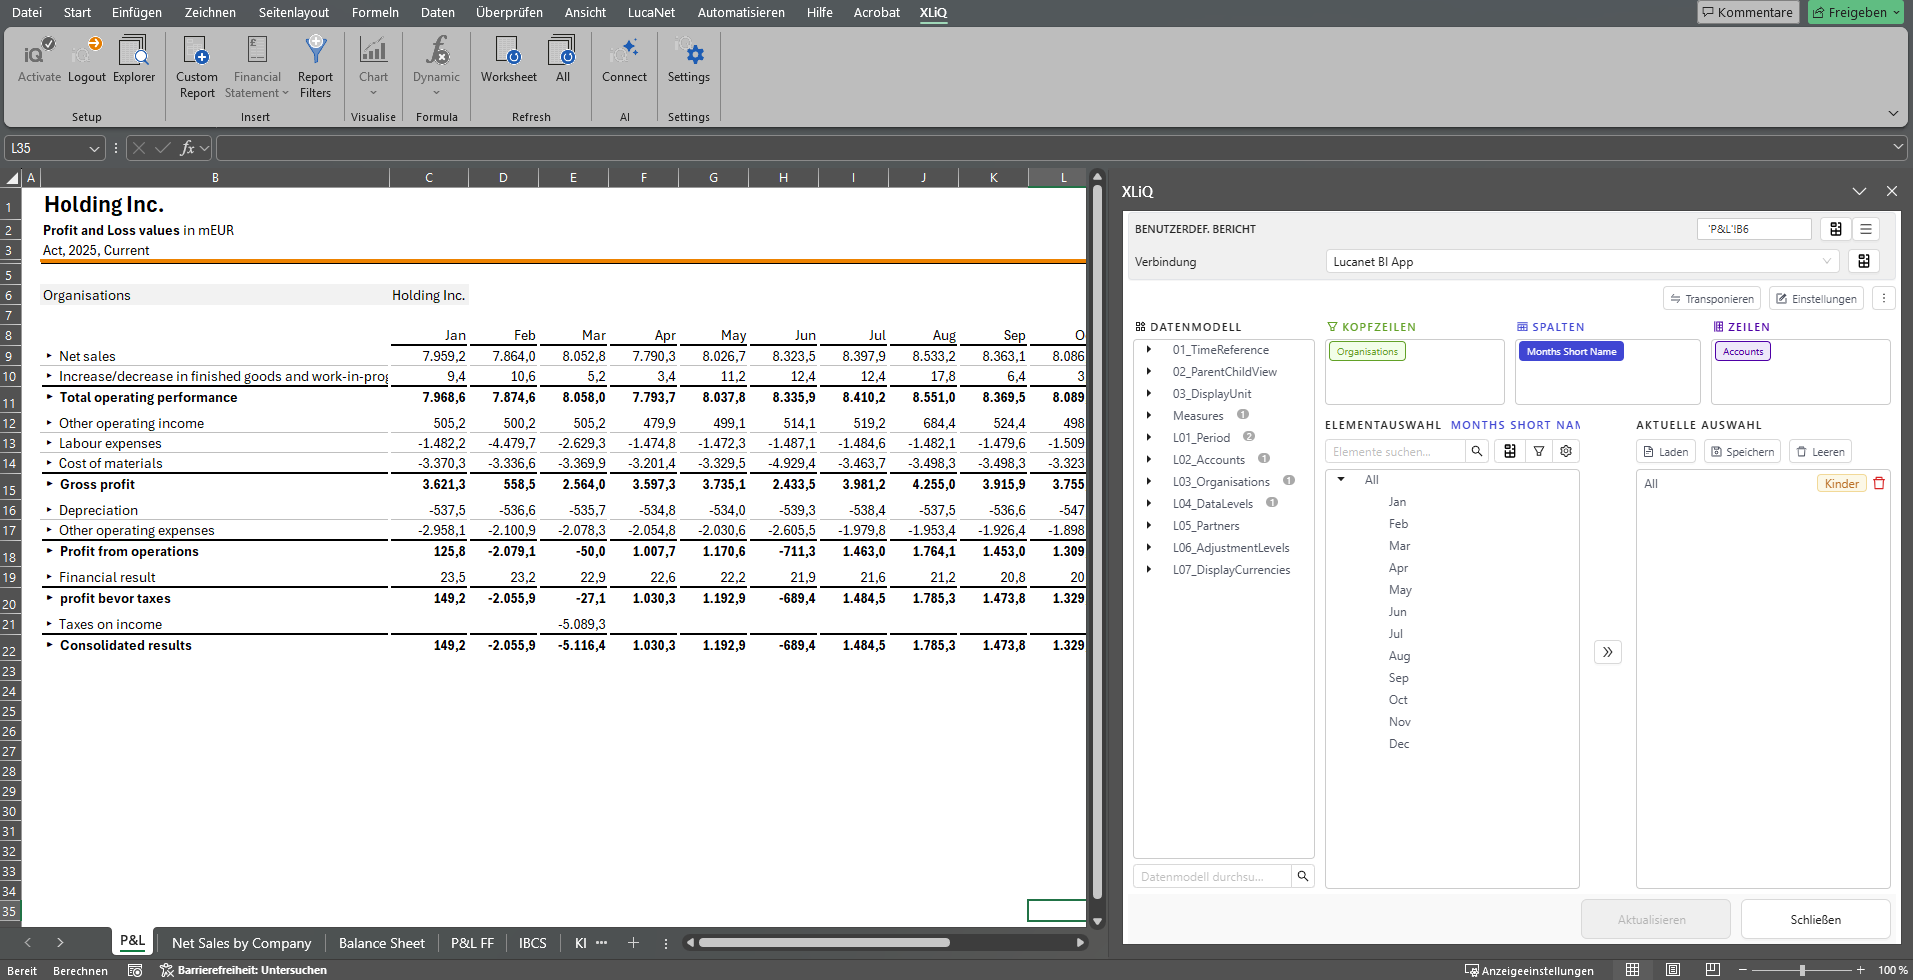
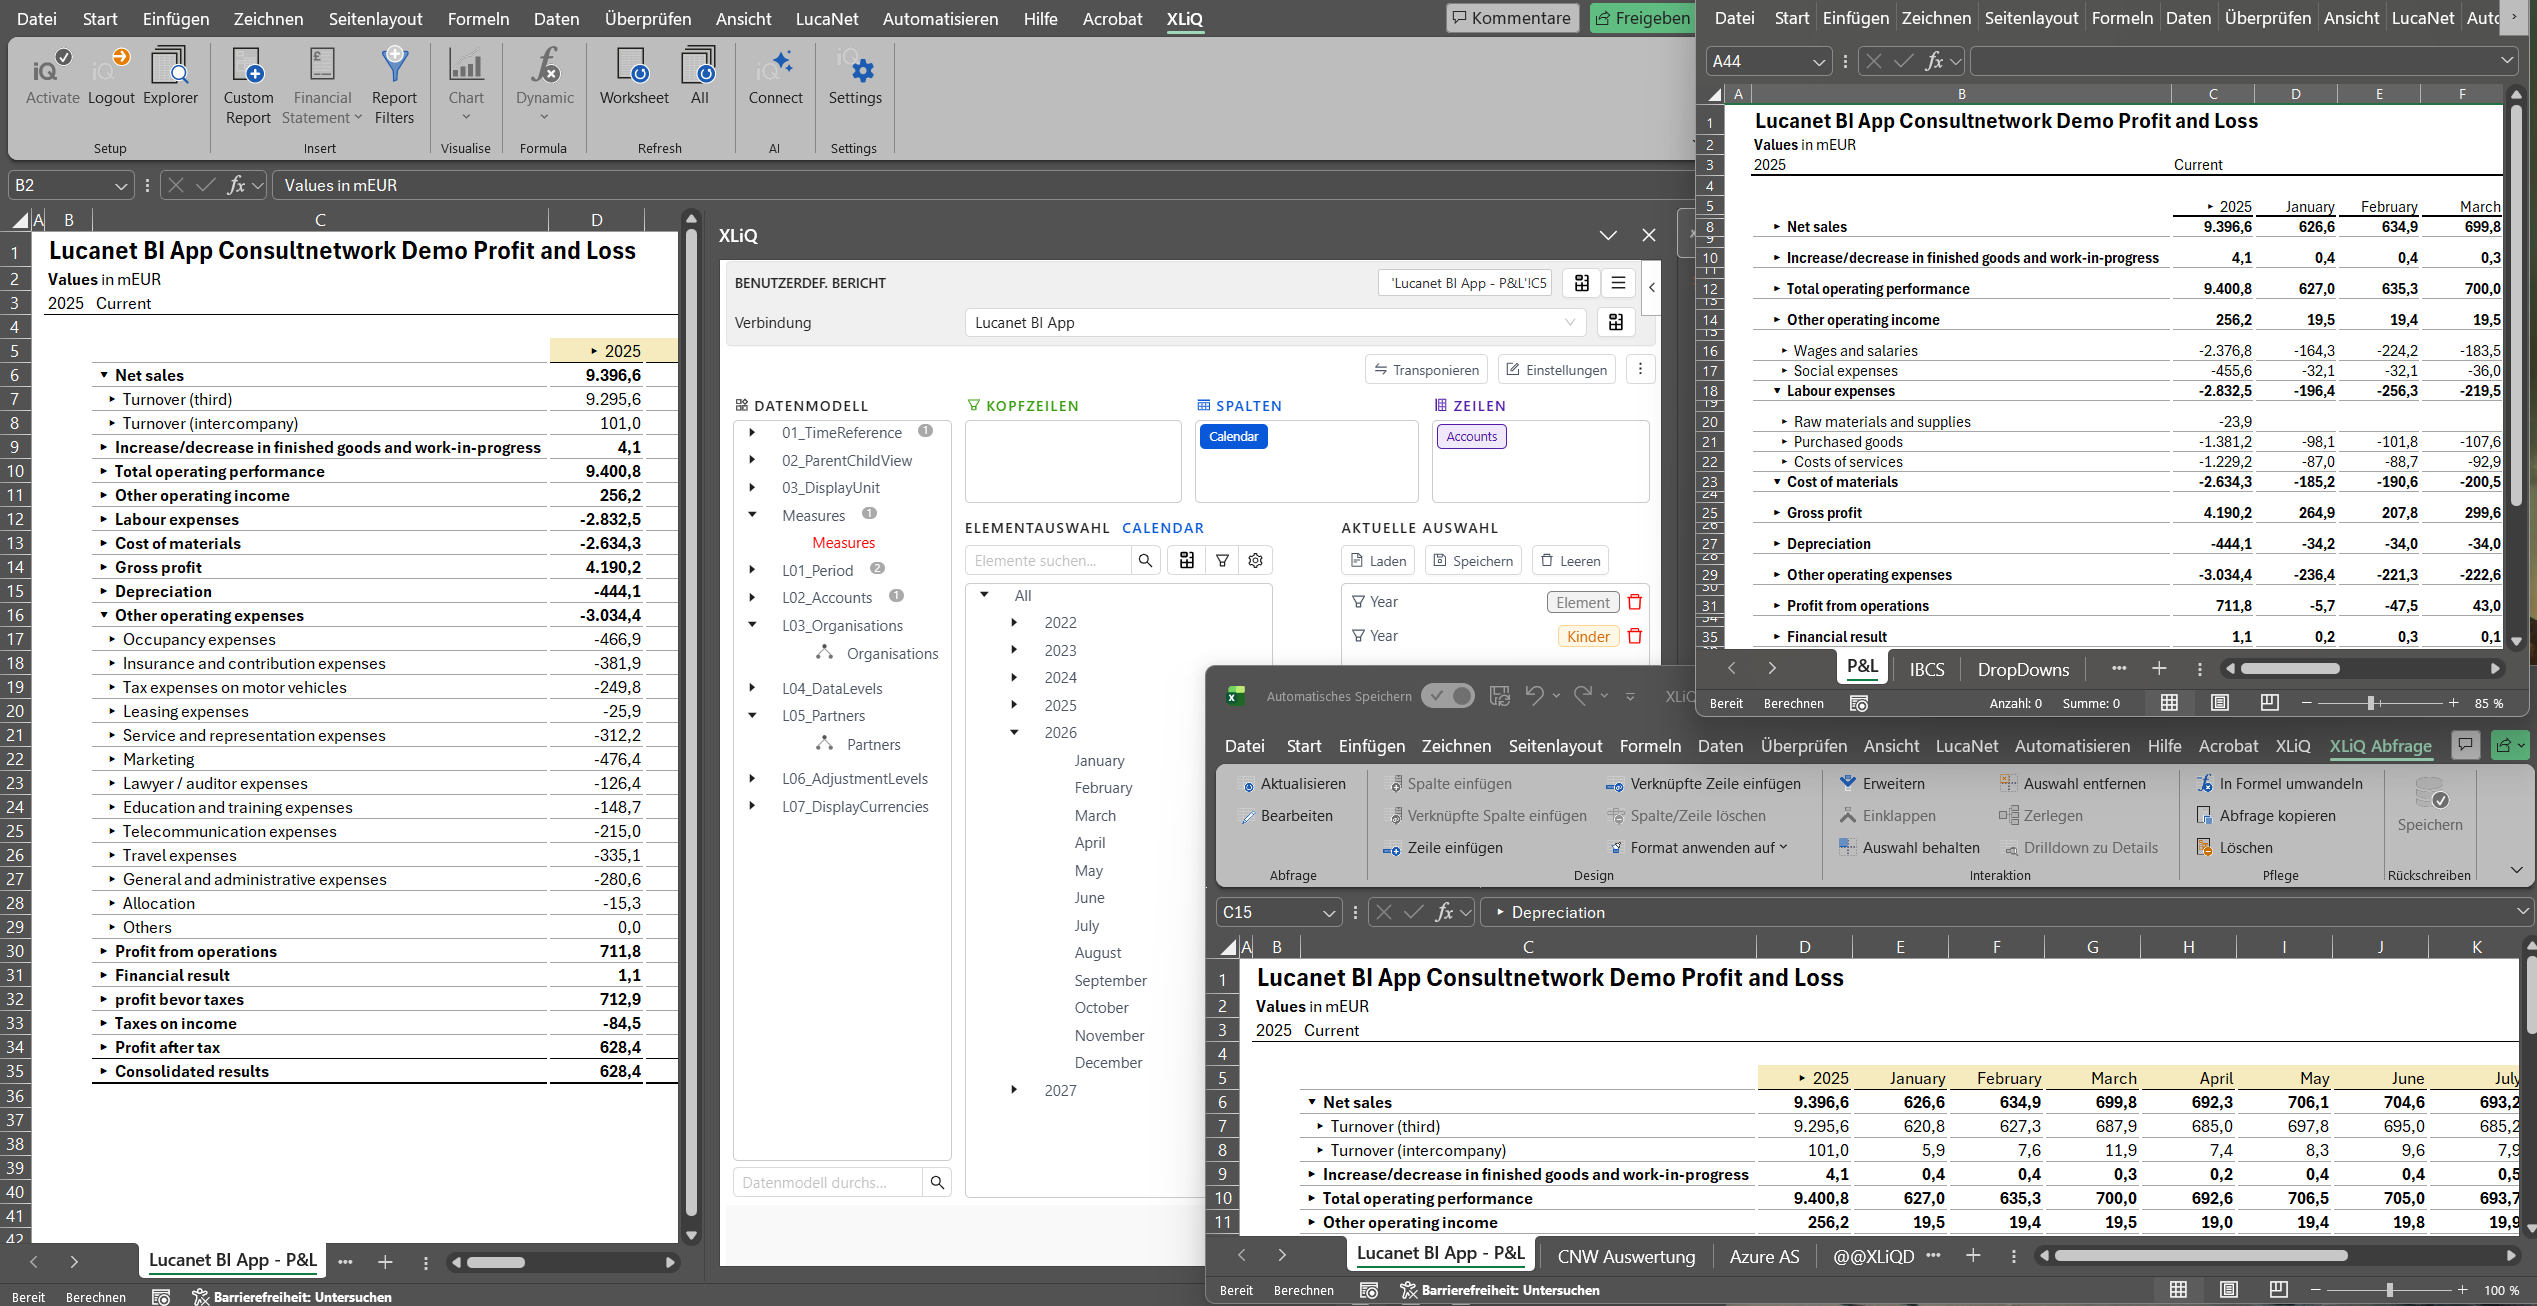
With the integrated Report Designer, users can build and edit their reports directly in Excel. Data can be analyzed and drilled down interactively, while dynamic selections and filters make even complex analyses easy to manage. Business users can therefore create and continuously develop their own reports without having to rely on the IT department for every adjustment.
At the same time, the central data foundation remains intact. XLiQ connects directly to your existing data models while respecting existing access permissions and security mechanisms. Instead of creating additional Excel copies and uncontrolled data exports, this provides a controlled connection between the central BI data foundation and individual analysis.
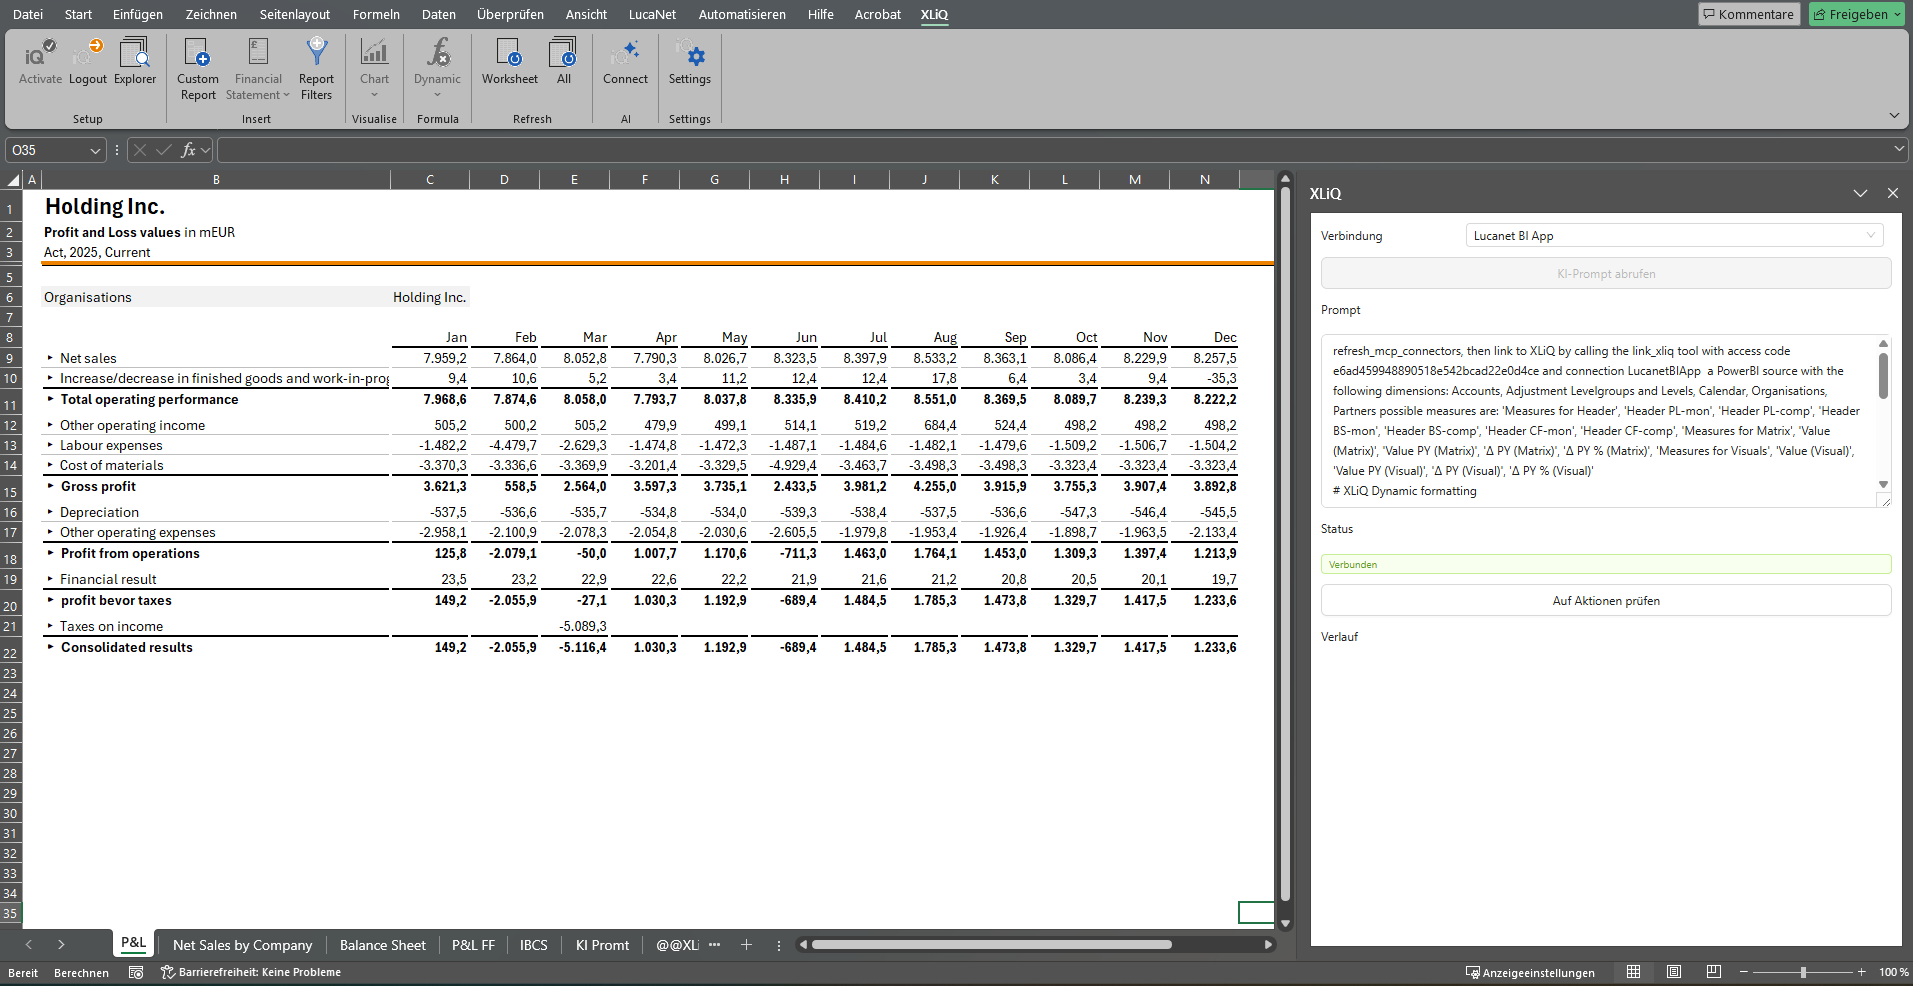
AI can also be integrated into this process. Through its own MCP server, assistants such as ChatGPT or Claude can securely work with the connected data and, for example, support analyses, create report elements, or automate reporting tasks.
Key benefits at a glance
Analyze Power BI models directly in Excel – on both Desktop and Web – without Excel becoming a limiting factor
Create reports directly in Excel without having to learn new software
Provide all employees and departments with consistent access to centralized data sources while respecting existing access permissions
Build dynamic, interactive reports with the integrated Report Designer
Support for leading AI assistants such as ChatGPT and Claude
Drill down from aggregated values to the lowest level of detail using Decompose
Use-cases for XLiQ
Controlling & Reporting
Management-Dashboards
Company-analysis
Business Intelligence
Financial planning
IBCS standardized reports
Get a free-trail
Experience XLiQ in your own working environment. Try all key features for free and see how you can make reporting, data analysis, and collaboration more efficient.
Advantages over Standard Excel
Far more powerful capabilities than Excel’s standard functionality for analyzing tabular models
Access centralized data models directly without relying on PivotTables
Create flexible reports and customized layouts directly on top of centralized data models
Build dynamic reports that automatically adapt to changes in the underlying data structures
Implement your own calculations and business logic directly in Excel
Use AI assistance for data queries and the creation of report elements directly in Excel
Mit Ihrer Zustimmung möchten wir Google Analytics (anonymisierte Besucherstatistik), Google Maps (Routenplanung) und YouTube (Videos) auf unserer Website einsetzen. Dabei werden Daten (z. B. Ihre IP-Adresse) an diese Anbieter übertragen und Cookies gesetzt. Über Ihre Zustimmung würden wir uns freuen. Vielen Dank.
Speicherdauer: Dieses Cookie bleibt nur für die aktuelle Browsersitzung bestehen.
Technischer Name: csrf_https-contao_csrf_token
Speichert die aktuelle PHP-Session.
Speicherdauer: Dieses Cookie bleibt nur für die aktuelle Browsersitzung bestehen.
Technischer Name: PHPSESSID
YouTube ist eine Online-Video-Plattform, auf der Nutzer Videos hochladen und anschauen können. Sie können Videos bewerten, in Playlisten speichern und kommentieren. Unternehmen können auf YouTube im Rahmen ihres Content Marketings Inhalte veröffentlichen. Zudem können sie YouTube-Videos auf ihrer Webseite einbetten.
Sobald Sie ein YouTube-Video auf dieser Website starten, wird eine Verbindung zu den Servern von YouTube hergestellt. Dabei wird dem YouTube-Server mitgeteilt, welche unserer Seiten Sie besucht haben. Wenn Sie in Ihrem YouTube-Account eingeloggt sind, ermöglichen Sie YouTube, Ihr Surfverhalten direkt Ihrem persönlichen Profil zuzuordnen. Dies können Sie verhindern, indem Sie sich aus Ihrem YouTube-Account ausloggen.
Des Weiteren kann YouTube nach Starten eines Videos verschiedene Cookies auf Ihrem Endgerät speichern oder vergleichbare Wiedererkennungstechnologien (z. B. Device-Fingerprinting) einsetzen. Auf diese Weise kann YouTube Informationen über Besucher dieser Website erhalten. Diese Informationen werden u. a. verwendet, um Videostatistiken zu erfassen, die Anwenderfreundlichkeit zu verbessern und Betrugsversuchen vorzubeugen.
Gegebenenfalls können nach dem Start eines YouTube-Videos weitere Datenverarbeitungsvorgänge ausgelöst werden, auf die wir keinen Einfluss haben.
Anbieter: Google Ireland Ltd., Gordon House, Barrow Street, Dublin 4, Ireland, Fax: +353 (1) 436 1001
Speicherdauer: Hier können Sie mehr über die Speicherdauer des Cookies erfahren: https://policies.google.com/privacy
Vimeo ist ein Online-Video-Portal. User können dort Videos hochladen, anschauen, kommentieren und bewerten. Unternehmen können auf dem Portal Videos für ihr Content Marketing veröffentlichen oder Vimeo-Videos auf ihrer Webseite einbetten.
Wenn Sie eine unserer mit Vimeo-Videos ausgestatteten Seiten besuchen, wird eine Verbindung zu den Servern von Vimeo hergestellt. Dabei wird dem Vimeo-Server mitgeteilt, welche unserer Seiten Sie besucht haben. Zudem erlangt Vimeo Ihre IP-Adresse. Wir haben Vimeo jedoch so eingestellt, dass Vimeo Ihre Nutzeraktivitäten nicht nachverfolgen und keine Cookies setzen wird.
Anbieter: Vimeo Inc., 555 West 18th Street, New York, New York 10011, USA
Speicherdauer: Hier können Sie mehr über die Speicherdauer des Cookies erfahren: https://vimeo.com/privacy
Google Maps ist ein Online-Kartendienst, über den Nutzer Straßenkarten sowie Luft- und Satellitenbilder aufrufen können. Gleichzeitig können sie darüber Routen planen und durch die Freigabe ihres Standortes ihre eigene Position ermitteln und Dritten anzeigen. Webseitenbetreiber nutzen Google Maps, um Usern Unternehmensinformationen wie Sitz, Telefonnummer, E-Mail und Bewertungen anzuzeigen.
Zur Nutzung der Funktionen von Google Maps ist es notwendig, Ihre IP-Adresse zu speichern. Diese Informationen werden in der Regel an einen Server von Google in den USA übertragen und dort gespeichert. Der Anbieter dieser Seite hat keinen Einfluss auf diese Datenübertragung. Wenn Google Maps aktiviert ist, kann Google zum Zwecke der einheitlichen Darstellung der Schriftarten Google Fonts verwenden. Beim Aufruf von Google Maps lädt Ihr Browser die benötigten Web Fonts in ihren Browsercache, um Texte und Schriftarten korrekt anzuzeigen.
Die Nutzung von Google Maps erfolgt im Interesse einer ansprechenden Darstellung unserer Online-Angebote und an einer leichten Auffindbarkeit der von uns auf der Website angegebenen Orte.
Anbieter: Google Ireland Ltd., Gordon House, Barrow Street, Dublin 4, Ireland, Fax: +353 (1) 436 1001
Speicherdauer: Hier können Sie mehr über die Speicherdauer des Cookies erfahren: https://policies.google.com/privacy
OpenStreetMap ist eine quelloffene Karte, die Unternehmen auf ihrer Webseite einbinden können, um beispielsweise ihren Unternehmensstandort anzuzeigen. User können über die Anwendung die Karte aufrufen und so zum Beispiel Routen planen.
Wir binden das Kartenmaterial von OpenStreetMap auf dem Server der OpenStreetMap Foundation aus Großbritannien, ein. Großbritannien gilt als datenschutzrechtlich sicherer Drittstaat. Das bedeutet, dass Großbritannien ein Datenschutzniveau aufweist, das dem Datenschutzniveau in der Europäischen Union entspricht. Bei der Nutzung der OpenStreetMap-Karten wird eine Verbindung zu den Servern der OpenStreetMap-Foundation hergestellt. Dabei können u. a. Ihre IP-Adresse und weitere Informationen über Ihr Verhalten auf dieser Website an die OpenStreetMap Foundation weitergeleitet werden. OpenStreetMap speichert hierzu unter Umständen Cookies in Ihrem Browser oder setzt vergleichbare Wiedererkennungstechnologien ein.
Anbieter: OpenStreetMap Foundation, St John’s Innovation Centre, Cowley Road, Cambridge, CB4 0WS
Speicherdauer: Hier können Sie mehr über die Speicherdauer der Cookies erfahren: https://osmfoundation.org/wiki/Privacy_Policy
Der Google Tag Manager ist ein Tool, mit dessen Hilfe wir Tracking- oder Statistik-Tools und andere Technologien auf unserer Website einbinden können. Der Google Tag Manager selbst erstellt keine Nutzerprofile, speichert keine Cookies und nimmt keine eigenständigen Analysen vor. Er dient lediglich der Verwaltung und Ausspielung der über ihn eingebundenen Tools. Der Google Tag Manager erfasst Daten auf der Webseite und leitet diese an die angebundenen Analyse-Tools weiter. Die Tools speichern und werten diese aus. Der Google Tag Manager speichert selbst keine Daten. Er hat darauf keinen Zugriff. Der Tag Manager erhebt lediglich Daten dazu, wie einzelne Tags verwendet werden. Der Google Tag Manager erfasst jedoch Ihre IP-Adresse, die auch an das Mutterunternehmen von Google in die Vereinigten Staaten übertragen werden kann.
Anbieter: Google Ireland Ltd., Gordon House, Barrow Street, Dublin 4, Ireland, Fax: +353 (1) 436 1001
Speicherdauer: Hier können Sie mehr über die Speicherdauer des Cookies erfahren https://policies.google.com/privacy.
Google Kalender ist ein Onlinedienst zur privaten Terminverwaltung des US-amerikanischen Unternehmens Google. Google Kalender ermöglicht das Erstellen und Bearbeiten von Kalendern mit Terminen und Erinnerungen. Nutzer können darüber Termine eintragen und andere User zu Terminen einladen. Sie können die Anwendung mit anderen Google-Diensten wie Google Drive und Google Meet verknüpfen.
Die eingegebenen Daten werden in Google Kalender für die Planung, die Durchführung, die Anzeige und ggf. für die Nachbereitung der Termine verwendet. Bei der Nutzung von Google Kalender werden personenbezogene Daten verarbeitet, gespeichert und an Google weitergegeben. Somit werden personenbezogene Daten auf den Servern von Google Calendar gespeichert.
Anbieter: Google Ireland Ltd., Gordon House, Barrow Street, Dublin 4, Ireland, Fax: +353 (1) 436 1001
Speicherdauer: Hier können Sie mehr über die Speicherdauer des Cookies erfahren: https://policies.google.com/privacy